In the vast world of digital marketing, understanding user behavior is essential for optimizing campaign performance. Funnel visualization emerges as an effective technique designed to provide clarity on the customer journey. This approach enables marketers to visualize the flow of potential customers through various stages, from initial awareness to final conversion. If a significant number of users are dropping off at different points, organizations risk losing potential revenue and leads. With the application of robust analytics in this process, teams can harness data-driven insights to pinpoint and address these drop-off moments effectively. By overcoming these hurdles, brands can enhance their conversion rates and improve overall marketing strategy.
Grasping the fundamentals of the marketing funnel is vital before effectively using funnel visualization to identify drop-off points. The marketing funnel consists of several distinct stages, each representing a critical phase in a customer’s decision-making journey. The stages usually include awareness, consideration, and conversion, wherein each one plays a unique role in guiding customers through to purchase or engagement. Understanding this progression helps in constructing a more precise funnel visualization model, allowing for clearer insights into user behavior. The significance of these stages cannot be overstated, as they provide context for why users may exit at certain points. The clearer the delineation of these stages, the better the strategy to rectify any weaknesses in the funnel.
Understanding the Marketing Funnel
Aware of Awareness
The first stage of the funnel is where potential customers first learn about a brand. This awareness can be driven through various channels, including social media, paid ads, and organic search results. Brands must capture attention quickly, as numerous distractions can lead potential customers away. The key here is not only to attract potential users but also to ensure that the message resonates with their needs. Crafting impactful marketing messages during this stage sets the tone for the relationship to follow. Thus, refining this initial outreach is crucial in laying the groundwork for future engagement.
Consideration Counts
Once potential customers are aware of your brand, they slowly move into the consideration stage. This phase involves evaluating their options, comparing your offerings with those of competitors. Detailed product descriptions, customer reviews, and side-by-side comparisons are vital here. An understanding of user intent is crucial; a prospect’s questions and needs can greatly influence their decision. Craft strategic content to address these inquiries and build trust throughout this stage. Effective communication and well-presented information here can meaningfully enhance the likelihood of conversion.
Setting Up Funnel Visualization

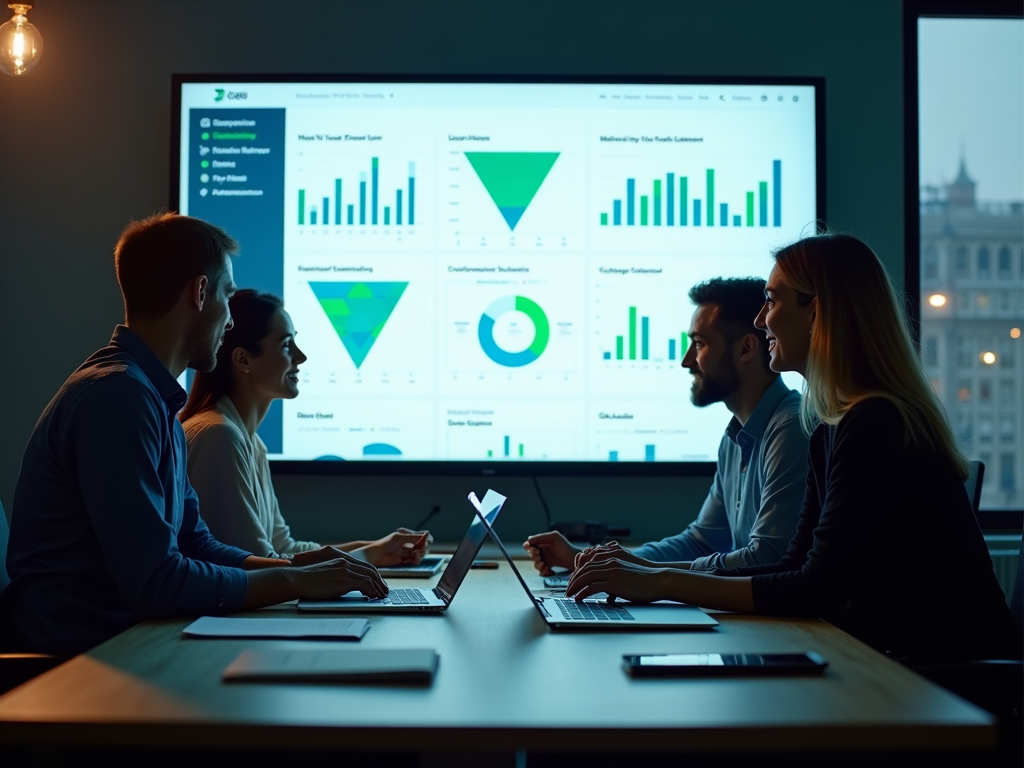
In order to utilize funnel visualization effectively, the setup process requires thoughtful consideration and the right tools. Choosing the appropriate analytics platform is the first step in establishing this funnel. Tools like Google Analytics, Mixpanel, or Hotjar can give marketers the necessary visualization features. Once the right platform is in place, the next step is to map out the customer journey accurately. Creating a visual representation of this journey helps delineate how users navigate your funnel and where adjustments are needed. This representation should include specific metrics and customer tracking elements.
- Visit Duration: Time users spend on each stage.
- Conversion Rate: Percentage of users moving from one stage to the next.
- Exit Rate: Number of users leaving at each stage.
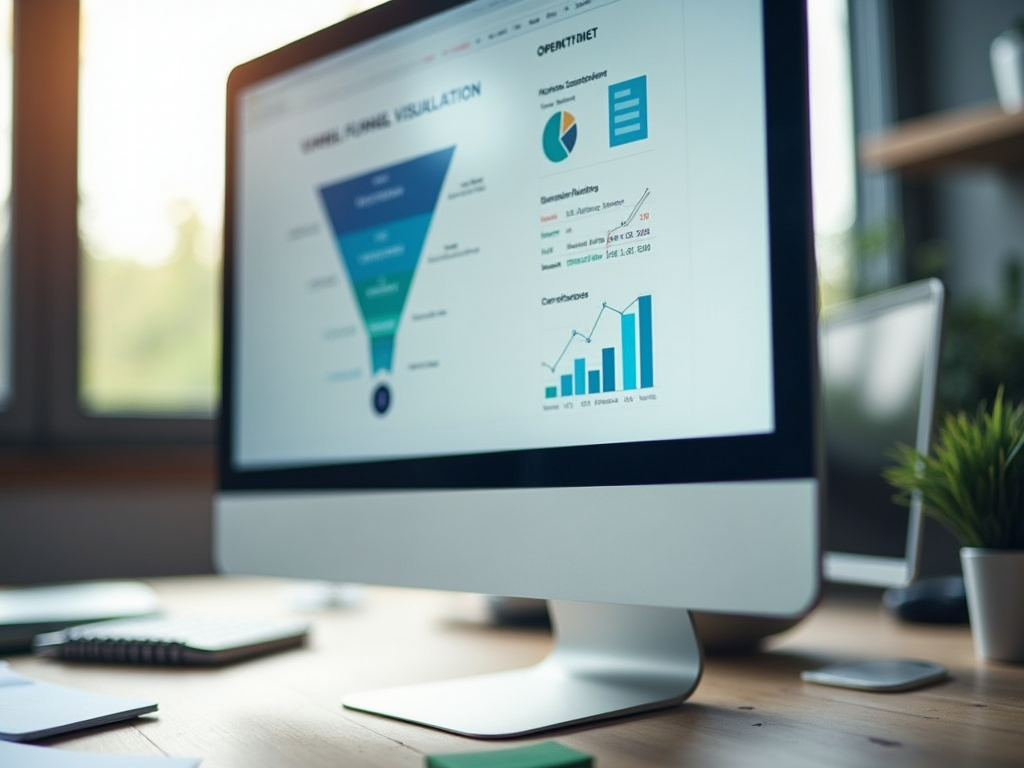
The visuals created during this phase do not only serve to highlight successful areas; they also pinpoint where users are exiting. A clear representation of user flow can facilitate quicker identification of gaps in the marketing strategy. It’s helpful to visualize these elements in a table for greater clarity, highlighting key metrics alongside their respective percentages captured during a campaign.
| Funnel Stage | Number of Users | Conversion Rate (%) |
|---|---|---|
| Awareness | 1,000 | 100% |
| Consideration | 400 | 40% |
| Conversion | 200 | 20% |
Analyzing Drop-Off Points
After establishing the funnel and gathering data, it becomes crucial to analyze drop-off points effectively. Understanding where users are exiting the funnel allows marketers to diagnose potential issues. Identifying these critical drop-off rates starts with diving deep into each stage of the funnel. It is necessary to identify patterns demonstrating user behavior changes at certain stages. Often, drop-off points will show significant fluctuations in conversion rates, serving as a red flag for marketers. Monitoring these transitions will enhance your understanding of user engagement.
Once high drop-off points are identified, the next logical step is to investigate why users are leaving. Qualitative data can be collected through user surveys, exit interviews, and analyzing browsing patterns via heatmaps or session recordings. These insights can reveal any friction points within the user experience that may deter engagement. Pay attention to features such as complex forms, slow-loading pages, or lengthy checkout processes. Addressing these concerns can significantly improve user retention rates at drop-off points. Gathering feedback is a critical component in ensuring that subsequent modifications to the user journey are based on solid data.
Strategies to Address Drop-Off Points
Upon identifying the principles behind user drop-offs, the next phase involves strategic improvement. Various methodologies can be employed to enhance user retention based on identified issues. It’s essential to focus on enhancing the overall user experience to minimize potential obstacles. This often includes redesigning web pages, optimizing navigation flows, or simplifying forms. A/B testing various approaches will also provide insight into which changes are most effective. Monitoring outcomes post-implementation will create a feedback loop to continuously refine user engagement processes.
- Simplifying navigation menus to increase user accessibility.
- Offering incentives such as discounts during the conversion stage.
- Enhancing page load speeds to reduce user frustration.
Итог
Employing funnel visualization is an indispensable strategy for identifying drop-off points within marketing campaigns. By analyzing where users exit a funnel, businesses can create targeted strategies to enhance user experience and maximize overall conversion rates. This process involves establishing a clear understanding of the marketing funnel stages, setting up effective visual tools, and diligently analyzing user data. Ultimately, attention to these drop-off points ensures that marketing campaigns are fine-tuned to meet user expectations and needs. As digital landscapes evolve, so too must the methods used to engage audiences, making funnel visualization an ongoing focal point for marketers.
Часто задаваемые вопросы
- What is funnel visualization? Funnel visualization is a tool that maps out the customer journey, highlighting user interaction at different stages to identify drop-off points in a marketing campaign.
- Why is it important to identify drop-off points? Identifying drop-off points allows marketers to understand where potential customers lose interest and make the necessary adjustments to improve conversion rates.
- What tools can I use for funnel visualization? Popular tools include Google Analytics, Mixpanel, and Hotjar, which provide features for tracking user behavior and visualizing funnels.
- How can I improve drop-off points identified in the funnel? To improve drop-off points, consider enhancing user experience, simplifying the navigation process, implementing A/B testing, and gathering qualitative feedback from users.
- Is funnel visualization effective for all types of marketing campaigns? Yes, funnel visualization can be applied across various marketing campaigns, including e-commerce, service-based businesses, and lead generation efforts.